April 30th, 2026
This is very preliminary work based on Lewis et al. (2020b). There will be major revisions during the next weeks. If you have doubts, questions, comments ect., please get in touch via e-mail (emanuel.gasteiger@tuwien.ac.at).
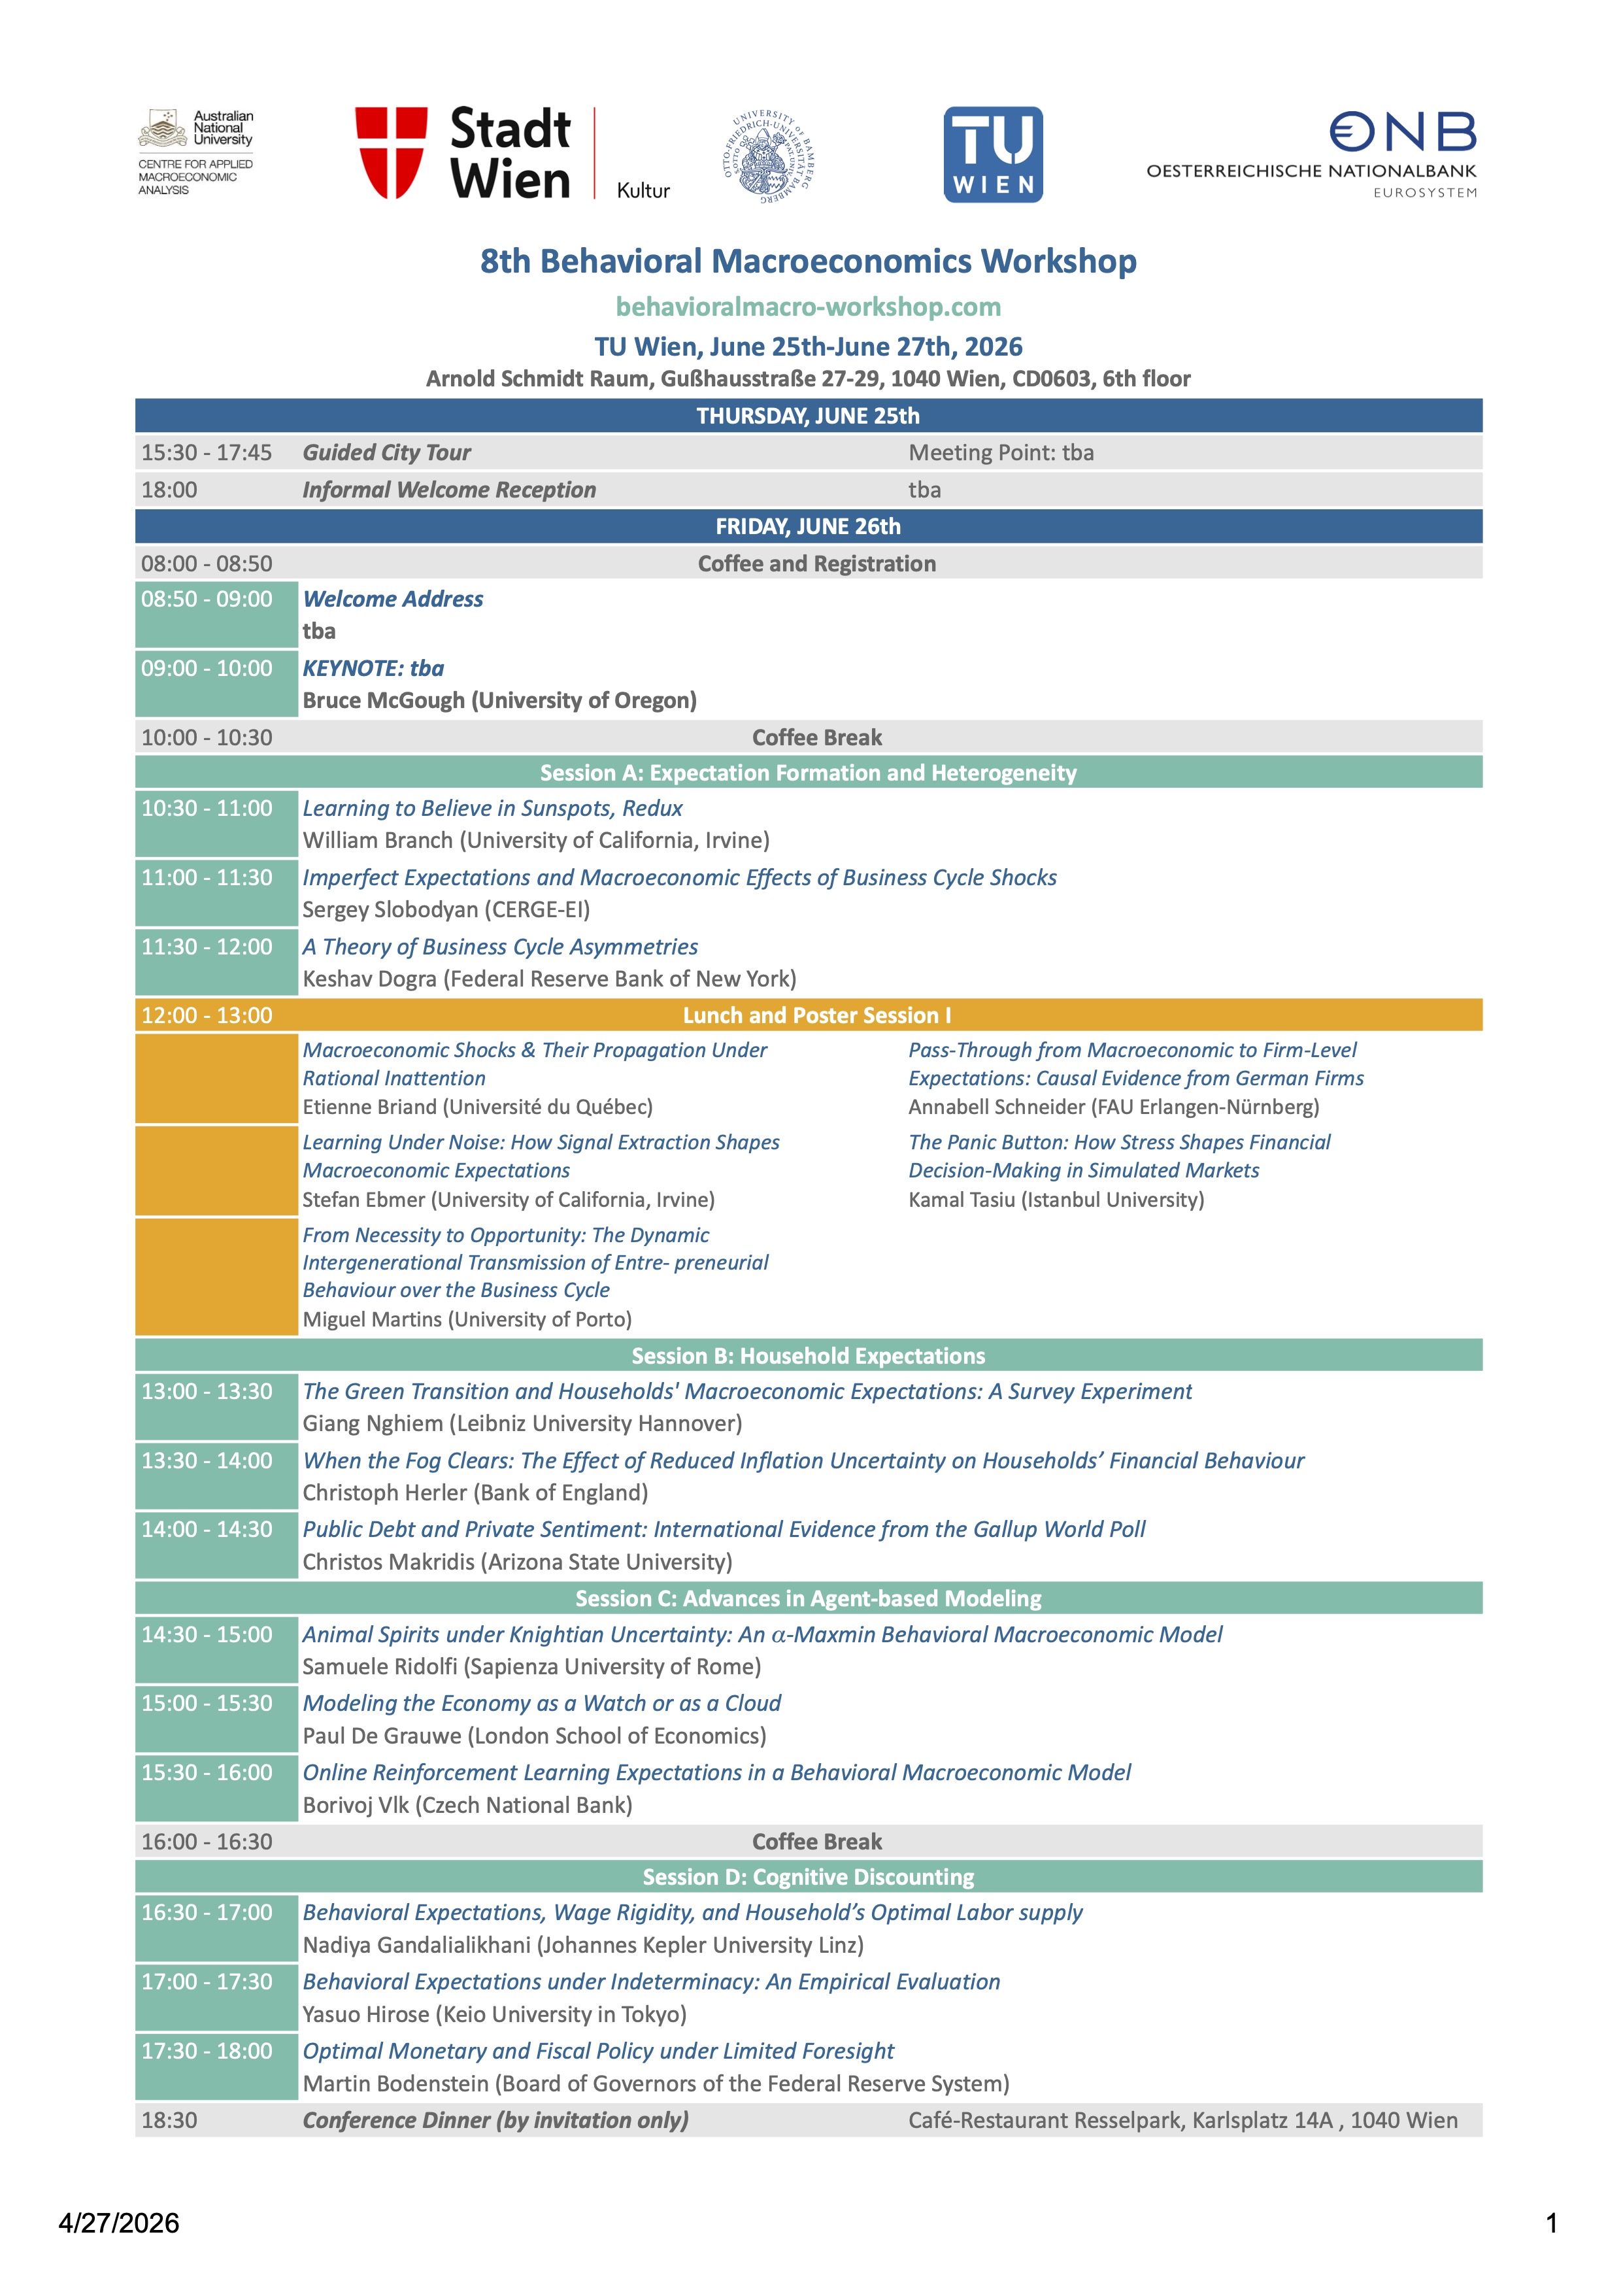
The AU-MEI is an index of (currently) 36 monthly series of economic activity in Austria scaled to the four-quarter real GDP growth rate.
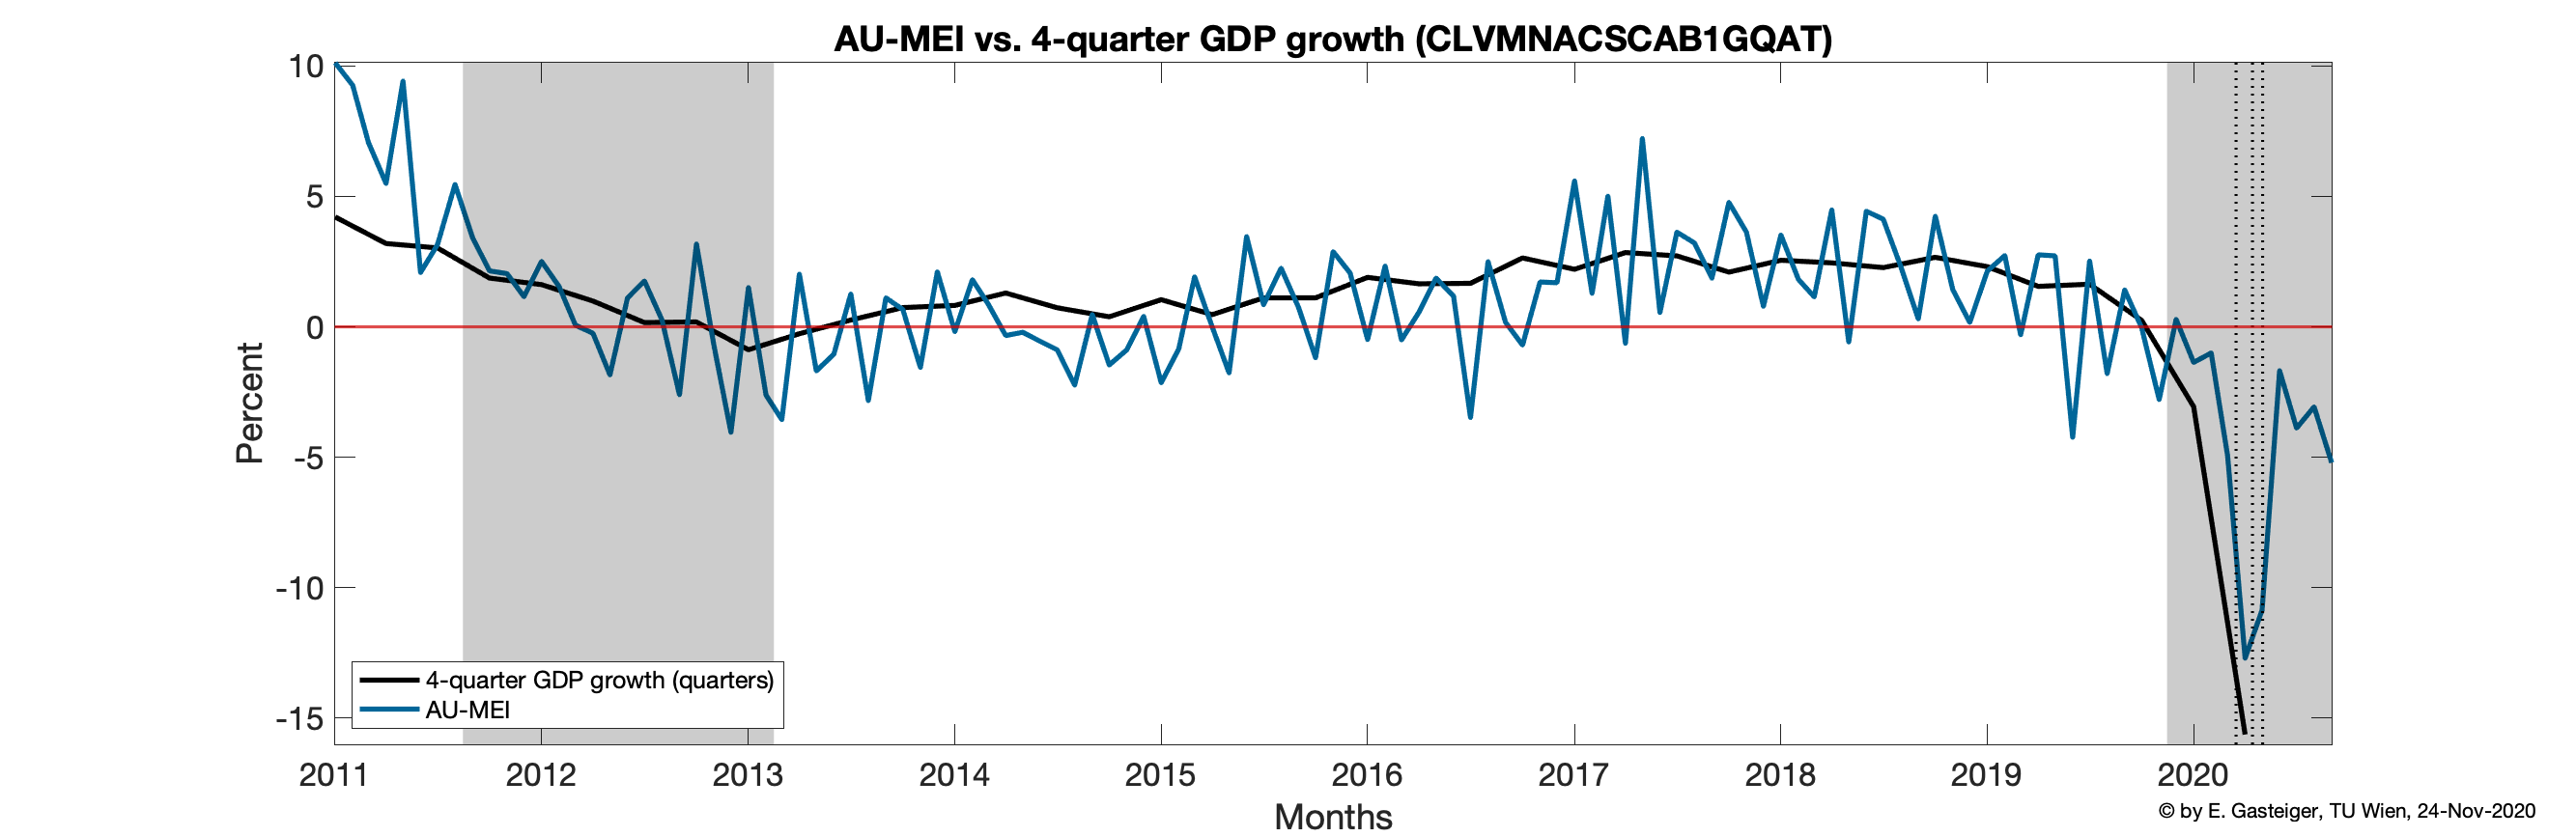
Based on the Statistik Austria (2020) Konjunkturmonitor release of 10-Nov-2020 the AU-MEI is -5.2 percent. If that value is the average for 2020Q3, one would expect, on average, real GDP that quarter to be -5.2 percent below real GDP a year before.
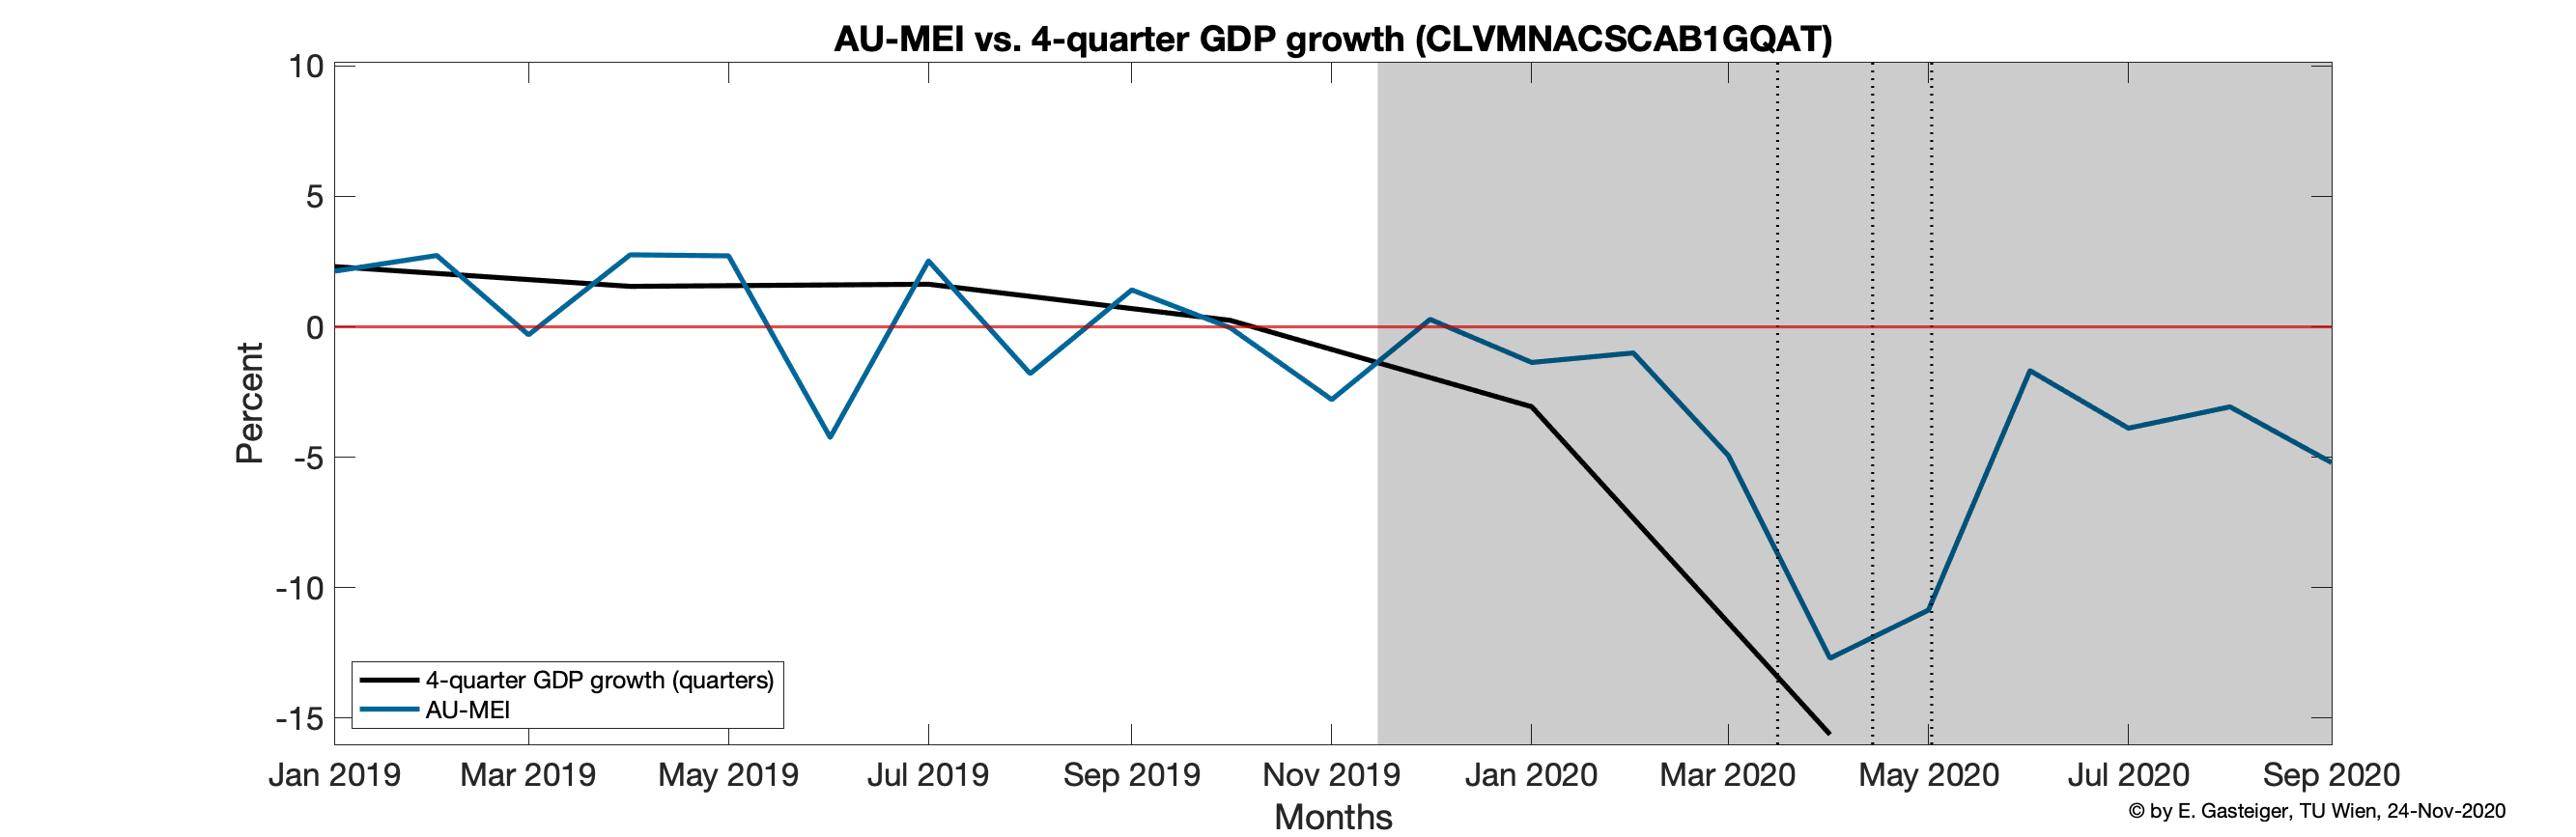
The grey shaded areas are the peak to trough quarters as determined by the CEPR-EABCN Euro Area Business Cycle Dating Committee. The vertical dotted lines mark the following events: 1st lockdown starts (16-Mar-2020 ), small shops open (14-Apr-2020), all shops open (02-May-2020).
The AU-MEI is an index of (currently) 36 monthly series of economic activity provided by Statistik Austria (2020)'s Konjunkturmonitor from 01-Jan-2011 onwards. The AU-MEI explains 43.1% of the total variance in the 36 series.
	Series                                      	  		  R-squ.   Weights
________________________________________________________________________ ________ _________
{'Turnover Index - Repair of motor vehicles and motorcycles'           } {'0.62'} {' 0.19'}
{'Turnover Index - Wholesale trade'                                    } {'0.86'} {' 0.23'}
{'Turnover Index - Retail trade'                                       } {'0.22'} {' 0.12'}
{'Index of persons employed - Repair of motor vehicles and motorcycles'} {'0.42'} {' 0.12'}
{'Index of persons employed - Wholesale trade'                         } {' 0.3'} {' 0.08'}
{'Index of persons employed - Retail trade'                            } {'0.54'} {' 0.15'}
{'Imports EU-27'                                                       } {'0.96'} {' 0.25'}
{'Imports Eurozone-19'                                                 } {'0.95'} {' 0.25'}
{'Imports Third Countries'                                             } {'0.54'} {' 0.18'}
{'Imports total SITC-0 Food'                                           } {'0.44'} {' 0.16'}
{'Imports total SITC-1 Beverages and tobacco'                          } {'0.17'} {' 0.09'}
{'Imports total SITC-2 Crude materials'                                } {'0.57'} {' 0.19'}
{'Imports total SITC-3 Mineral fuels'                                  } {'0.46'} {' 0.14'}
{'Imports total SITC-4 Animal and vegetable oils, fats and waxes'      } {'0.18'} {' 0.15'}
{'Imports total SITC-5 Chemicals and related products, n.e.s.'         } {'0.13'} {'  0.1'}
{'Imports total SITC-6 Manufactured goods'                             } {'0.79'} {' 0.23'}
{'Imports total SITC-7 Machinery and transport equipment'              } {'0.82'} {' 0.22'}
{'Imports total SITC-8 Miscellaneous manufactured articles'            } {'0.78'} {' 0.21'}
{'Imports total SITC-9 Commodities, n.e.s.'                            } {'   0'} {' 0.08'}
{'Exports EU-27'                                                       } {'0.86'} {' 0.23'}
{'Exports Eurozone-19'                                                 } {' 0.8'} {' 0.22'}
{'Exports Third Countries'                                             } {'0.75'} {'  0.2'}
{'Exports total SITC-0 Food'                                           } {'0.39'} {' 0.17'}
{'Exports total SITC-1 Beverages and tobacco'                          } {'0.22'} {' 0.12'}
{'Exports total SITC-2 Crude materials'                                } {'0.78'} {' 0.21'}
{'Exports total SITC-3 Mineral fuels'                                  } {'0.34'} {' 0.12'}
{'Exports total SITC-4 Animal and vegetable oils, fats and waxes'      } {'0.15'} {' 0.11'}
{'Exports total SITC-5 Chemicals and related products, n.e.s.'         } {'0.03'} {' 0.09'}
{'Exports total SITC-6 Manufactured goods'                             } {'0.87'} {' 0.23'}
{'Exports total SITC-7 Machinery and transport equipment'              } {' 0.8'} {' 0.22'}
{'Exports total SITC-8 Miscellaneous manufactured articles'            } {'0.66'} {' 0.18'}
{'Exports total SITC-9 Commodities, n.e.s.'                            } {'0.01'} {' 0.05'}
{'Inland waterway transport'                                           } {'0.01'} {'-0.02'}
{'Commercial aviation'                                                 } {'0.12'} {'-0.03'}
{'Registration of new passenger cars'                                  } {' 0.4'} {' 0.13'}
{'Overnight stays'                                                     } {'0.23'} {'-0.09'}
________________________________________________________________________ ________ _________
{'Total variance explained'                                            } {'43.1'}
________________________________________________________________________ ________ _________
Note:
- All values are rounded;
- R-squared is based on regressing a Series on the AU-MEI;
- Weights of the AU-MEI are estimated to maximise the total variance explained;
- Estimation sample for weights is 01-Jan-2011 till 29-Feb-2020;
- Sum of squared(!) weights (=loadings) sums up to one;
- A weight's sign indicates a positive or negative relationship to the AU-MEI;
- A weight's absolute value indicates the strength of the relationship;
No. So far, the AU-MEI is an adoption of the Lewis et al. (2020a) WEI for the US developed in Lewis et al. (2020b) based on weekly(!) data.
Following Lewis et al. (2020b), the AU-MEI is scaled to Austria's four-quarter GDP growth rate. Therefore, if the AU-MEI stands at -2 percent and that level of the AUMEI is the average for the entire quarter (Q3: July to September), `one would expect, on average, GDP that quarter to be 2 percent lower than a year previously.'
This is difficult to answer in an ad-hoc manner. One of the main motivations of this project is actually to come up with answer to the question of whether the AU-MEI and the underlying Dynamic Factor Model are delivering a reasonable performance. This is one of the next steps (see below).
Yes, below I plan to provide details for each release (coming soon).
| 24th-Nov-20 | 2nd (prelim.) release: Based on the Statistik Austria (2020) Konjunkturmonitor release of 10-Nov-2020 the AU-MEI is -5.2 percent. This revision is due to code de-bugging. More details on the construction (PDF coming soon). | |
| 17th-Nov-20 | 1st (prelim.) release: Based on the Statistik Austria (2020) Konjunkturmonitor release of 10-Nov-2020 the AU-MEI is -3.93 percent. More details on the construction (PDF coming soon). | |


New publication

Recruiting: Assistant Professor in Macroeconomics (6 years, Non-Tenure Track)
Project funding approved